
VidaMinds
Based on authentic financial data, we deliver useful, innovative, and reliable qualitative analytics to enrich your quantitative/data-driven investment/trading process.
Established in the year 2017.
Methodology
Automated Systematic Qualitative Analysis: asked relevant questions, quantified definitions, compared and related concepts, and then formed answers.
Automated Systematic Quantitative Analysis: assuming a stable distribution, seeking for models with reliable generalization capability to handle unseen data points.
All are integrated in a scientific way.
Products

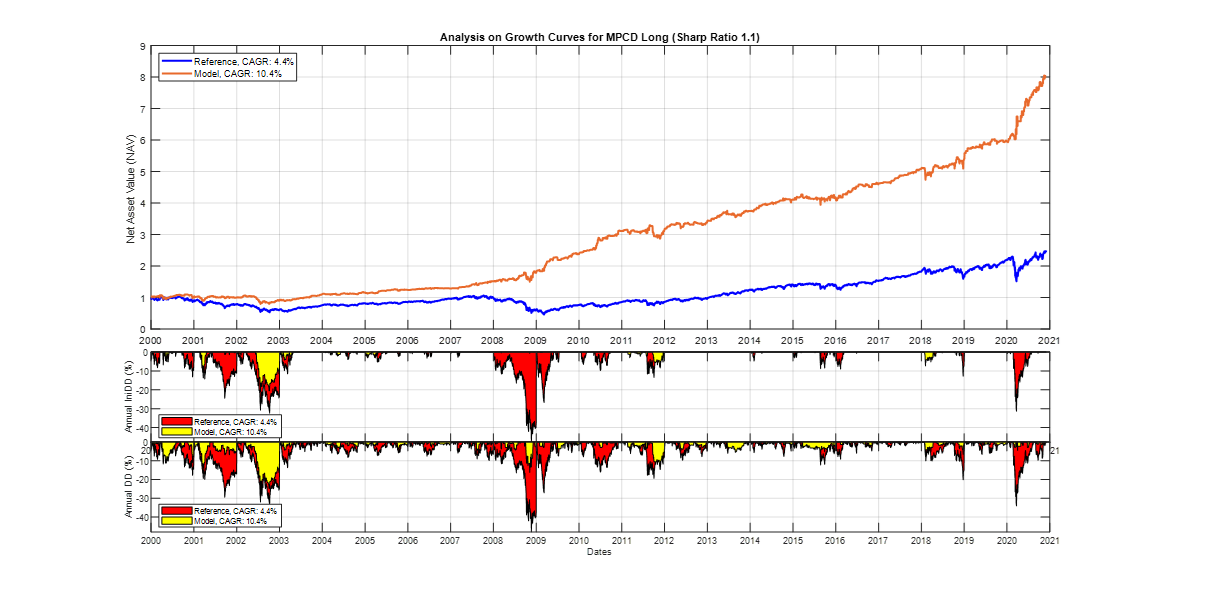
VMR005: U.S. Momentum Put-Call Deviation (MPCD) Daily Metrics [Download Evaluation Package]
- Are you still using the Put/Call Ratio (PCR) data from CME or ISE to measure investors’ overall sentiment in U.S. market? It is time to upgrade!
- Compared with the PCR data from ISE or CME, our approach is more selective
and only a small set of equity options are used. Investors can use this MPCD metric to
manage their short-term risk.
- Sample strategies are available. A simple rule, "MPCD < 0 then long SPY for the next day", could generate CAGR > 10%, Sharpe ratio > 1.1, and averaged maximum drawdown (daily observation) < -8%; Longer holding periods are also profitable (with good return/risk ratios). See the following chart for performances. Please check the white paper (download the evaluation package) for details.
- daily update 5 minutes before U.S. market closes (ET) so investors have about 5 mins to enter the market.
- measure investors' overall sentiment in U.S. equity market.
- historical data from 2000
- no fitting of the historical market prices
- point-in-time, no any backrevision or future forward-looking
- annual subscription, cloud-based FTP delivery
- please contact us for more information.
VMP001. U.S. Equity Daily Earnings Call Metrics [Download Evaluation Package]
- 7 innovative and insightful factors such as certainty score, deception score, and forward-looking expectation score, etc.
- daily update at midnight (EST)
- U.S. equity market
- suitable for stock trading, medium to long term
- historical analytics from 2004
- covers more than 2800 stocks
- point-in-time, no any backrevision or future forward-looking; For factors released at the midnight on day D, "not only the data used, but also the computation algorithm itself calibrated, any features/parameters selected, also only using data before or up to the day D."
- complete history, all delisted tickers were kept
- each factor is based on a micro-NLP-model, which is customized/adapted from some simple NLP models or datasets. To ensure that our factors are interpretable, we do not mix or
combine these micro-NLP-models.
- qualitative analysis, quantitative analysis, compared and related
- annual subscription, cloud-based FTP delivery
- published & started live feed in Feb. 2018.
- please contact us for more information.
VMP003. U.S. Equity Daily 10-K Reports Metrics [Download Evaluation Package]
- 55 innovative and insightful factors, cover all major aspects of 10K filing.
- very low correlations among these factors.
- for each factor, comprehensive quarterly re-balanced L/S quantile portfolio performance reports available (survivalship bias is considered).
- rigorous statistical evaluations for these portfolios are ready: net return, characteristics-adjusted return, and alphas from Fama-French 4 factors model
- some L/S portfolios (quarterly re-balanced) constructed from a single factor gain more than 100% (some even 200%) accumulated simple returns from 1999 to 2017.
- daily update after market close
- U.S. equity market
- suitable for stock trading, medium to long term
- historical analytics from 1999, Point-In-Time
- covers more than 13000 unqiue CIKs
- point-in-time, no any backrevision or future forward-looking; For factors released at the midnight on day D, "not only the data used, but also the computation algorithm itself calibrated, any features/parameters selected, also only using data before or up to the day D."
- complete history, all delisted tickers were kept
- each factor is based on a micro-NLP-model, which is customized/adapted/dynamically updated from some simple NLP models or datasets. To ensure that our factors are interpretable, we do not mix or
combine these micro-NLP-models.
- qualitative analysis, quantitative analysis, compared and related
- annual subscription, cloud-based FTP delivery
- published & started live feed in Jan. 2019.
- please contact us for more information.
Team

We are investment professionals, scientists and engineers, with extensive experience in structured data modeling, unstructured data modeling, and data-driven investment decision research.
Together, we do investment decision research, using machine intelligence, statistical analysis, natural language processing, computer vision, etc.
Our Edge
We know what information to extract, and we know how to extract them.
Research Core
Founded by a group of Ph.D. researchers with extensive experience in U.S. markets.
Tech Core
We have a solid software engineering team which maintains our daily operation and data delivery.
Research Partnership
We are backed by several assistant/associate professors of Finance in U.S. universities. They help us stay on top of all latest academic research results.
Clients

We serve serious investors and systems.
Current clients include several top hedge funds in the U.S.
Contact
Address:41 E 11th St., 11th Floor, New York, NY 10003
Email:
Please include the product No. in your inquiry, Thanks!